Maximize Core Web Vitals & Peak Website Speed
Slash bounce rates, improve user retention, and dominate search engine rankings. We optimize server architecture, cache layers, database queries, and frontend assets to unlock your website's maximum technical potential.
# CSS/JS minified and compiled. Deferring non-essential blocks.
Service Specifications & Technical SLA
- Turnaround & Response SLA
- 2 to 5 Business Days (includes 48-hour post-launch validation)
- Pricing & Retainer Model
- $150 – $300 One-Time Optimization (or included in VPS Care at $80/mo)
- Client Guarantee
- Target 90–100 Google PageSpeed scores, sub-1.2s LCP, zero visual or checkout breakage.
- Supported Platforms & Operating Systems
- WordPress, WooCommerce, LearnDash, MemberPress, Next.js, Laravel | Nginx, LiteSpeed, Apache, PHP (7.4–8.4), Redis, MySQL/MariaDB & Any Web Hosting Server Worldwide
- Primary Deliverables
- Core Web Vitals tuning (LCP, INP, CLS), TTFB reduction, Redis object cache, PHP-FPM pool sizing, critical CSS extraction, asset minification.
Avg load time goal after applying full-stack caching mechanics.
Focus on both Mobile & Desktop Google Web Dev standards.
Tuned Linux processes and server caching layers.
Our Multi-Layer Speed Framework
True optimization extends beyond basic plugins. We restructure and configure your entire stack across 4 key technological layers.
Edge Routing & DNS
Premium DNS mapping, Cloudflare custom page rules configuration, full HTTP/3 activation, and server-push early hints.
Web Server Overhaul
Nginx FastCGI microcaching, Gzip/Brotli layout compression configs, and fine-tuning worker processes boundaries.
Backend & Database
OPcache script preloading, Redis dynamic object-caching storage, and MySQL query performance analysis.
Frontend Rendering
Critical CSS injection, asynchronous JavaScript deferment, AVIF image generation, and local web font preloading.
Advanced Frontend Alignment & Asset Optimization
We remove unnecessary client-side weight that blocks page rendering. Your core files are restructured to yield top-performing metrics from the first millisecond.
- Inline extraction of Above-the-Fold Critical CSS
- Asynchronous loading for third-party scripts and triggers
- Next-gen WebP & AVIF conversion + responsive layout mapping
- Localized web font layouts to eliminate shifts (FOUT)
Origin Server Overhaul & Caching Core
We configure the server's processes and storage systems to hand back web responses instantaneously. This guarantees that your CPU runs efficiently even under massive waves of client checkouts.
- FastCGI microcaching configuration at server root level
- Dynamic server worker (PHP-FPM) memory allocation locks
- Redis object caching integrations to relieve SQL tasks
- Active OPcache script caching to lower origin workload
WordPress, WooCommerce & Membership Speed Optimization
Dynamic membership portals, LMS platforms (LearnDash, MemberPress), and high-volume WooCommerce stores cannot rely on static page caching for logged-in buyers and checkout funnels. We engineer specialized backend solutions that keep dynamic transactions fast under heavy traffic surges.
- WooCommerce Cart & Checkout: Eliminate cart fragmentation lags (
wc-ajax=get_refreshed_fragments) and optimize instant dynamic checkout response. - Redis Persistent Object Cache: Store complex SQL queries in RAM memory to reduce origin MySQL queries by up to 85% for logged-in users.
- AJAX & Heartbeat Throttling: Tame excessive
admin-ajax.phpcalls from membership plugins and heavy widgets. - Database Defragmentation: Clean orphaned transients, purge bloated
wp_optionsautoload records, and index postmeta tables.
Calculate Your PageSpeed Revenue Loss
Adjust Your Metrics Target Speed: 1.2s
Projected Speed Improvements
We solve speed bottlenecks at the server & core system level.
Disclaimer: Projections are estimates based on standard Google Web Dev benchmarks and studies on the financial impact of latency. Actual conversion gains vary based on business models, checkout flows, and user intent. Full speed alignment is included in our managed web optimization packages.
High-Performance Web Development & Revamp
Every website I develop or optimize is engineered for maximum speed and flawless Google PageSpeed scores. Speed isn't a secondary option—it is core to search ranking, conversion, and user satisfaction.
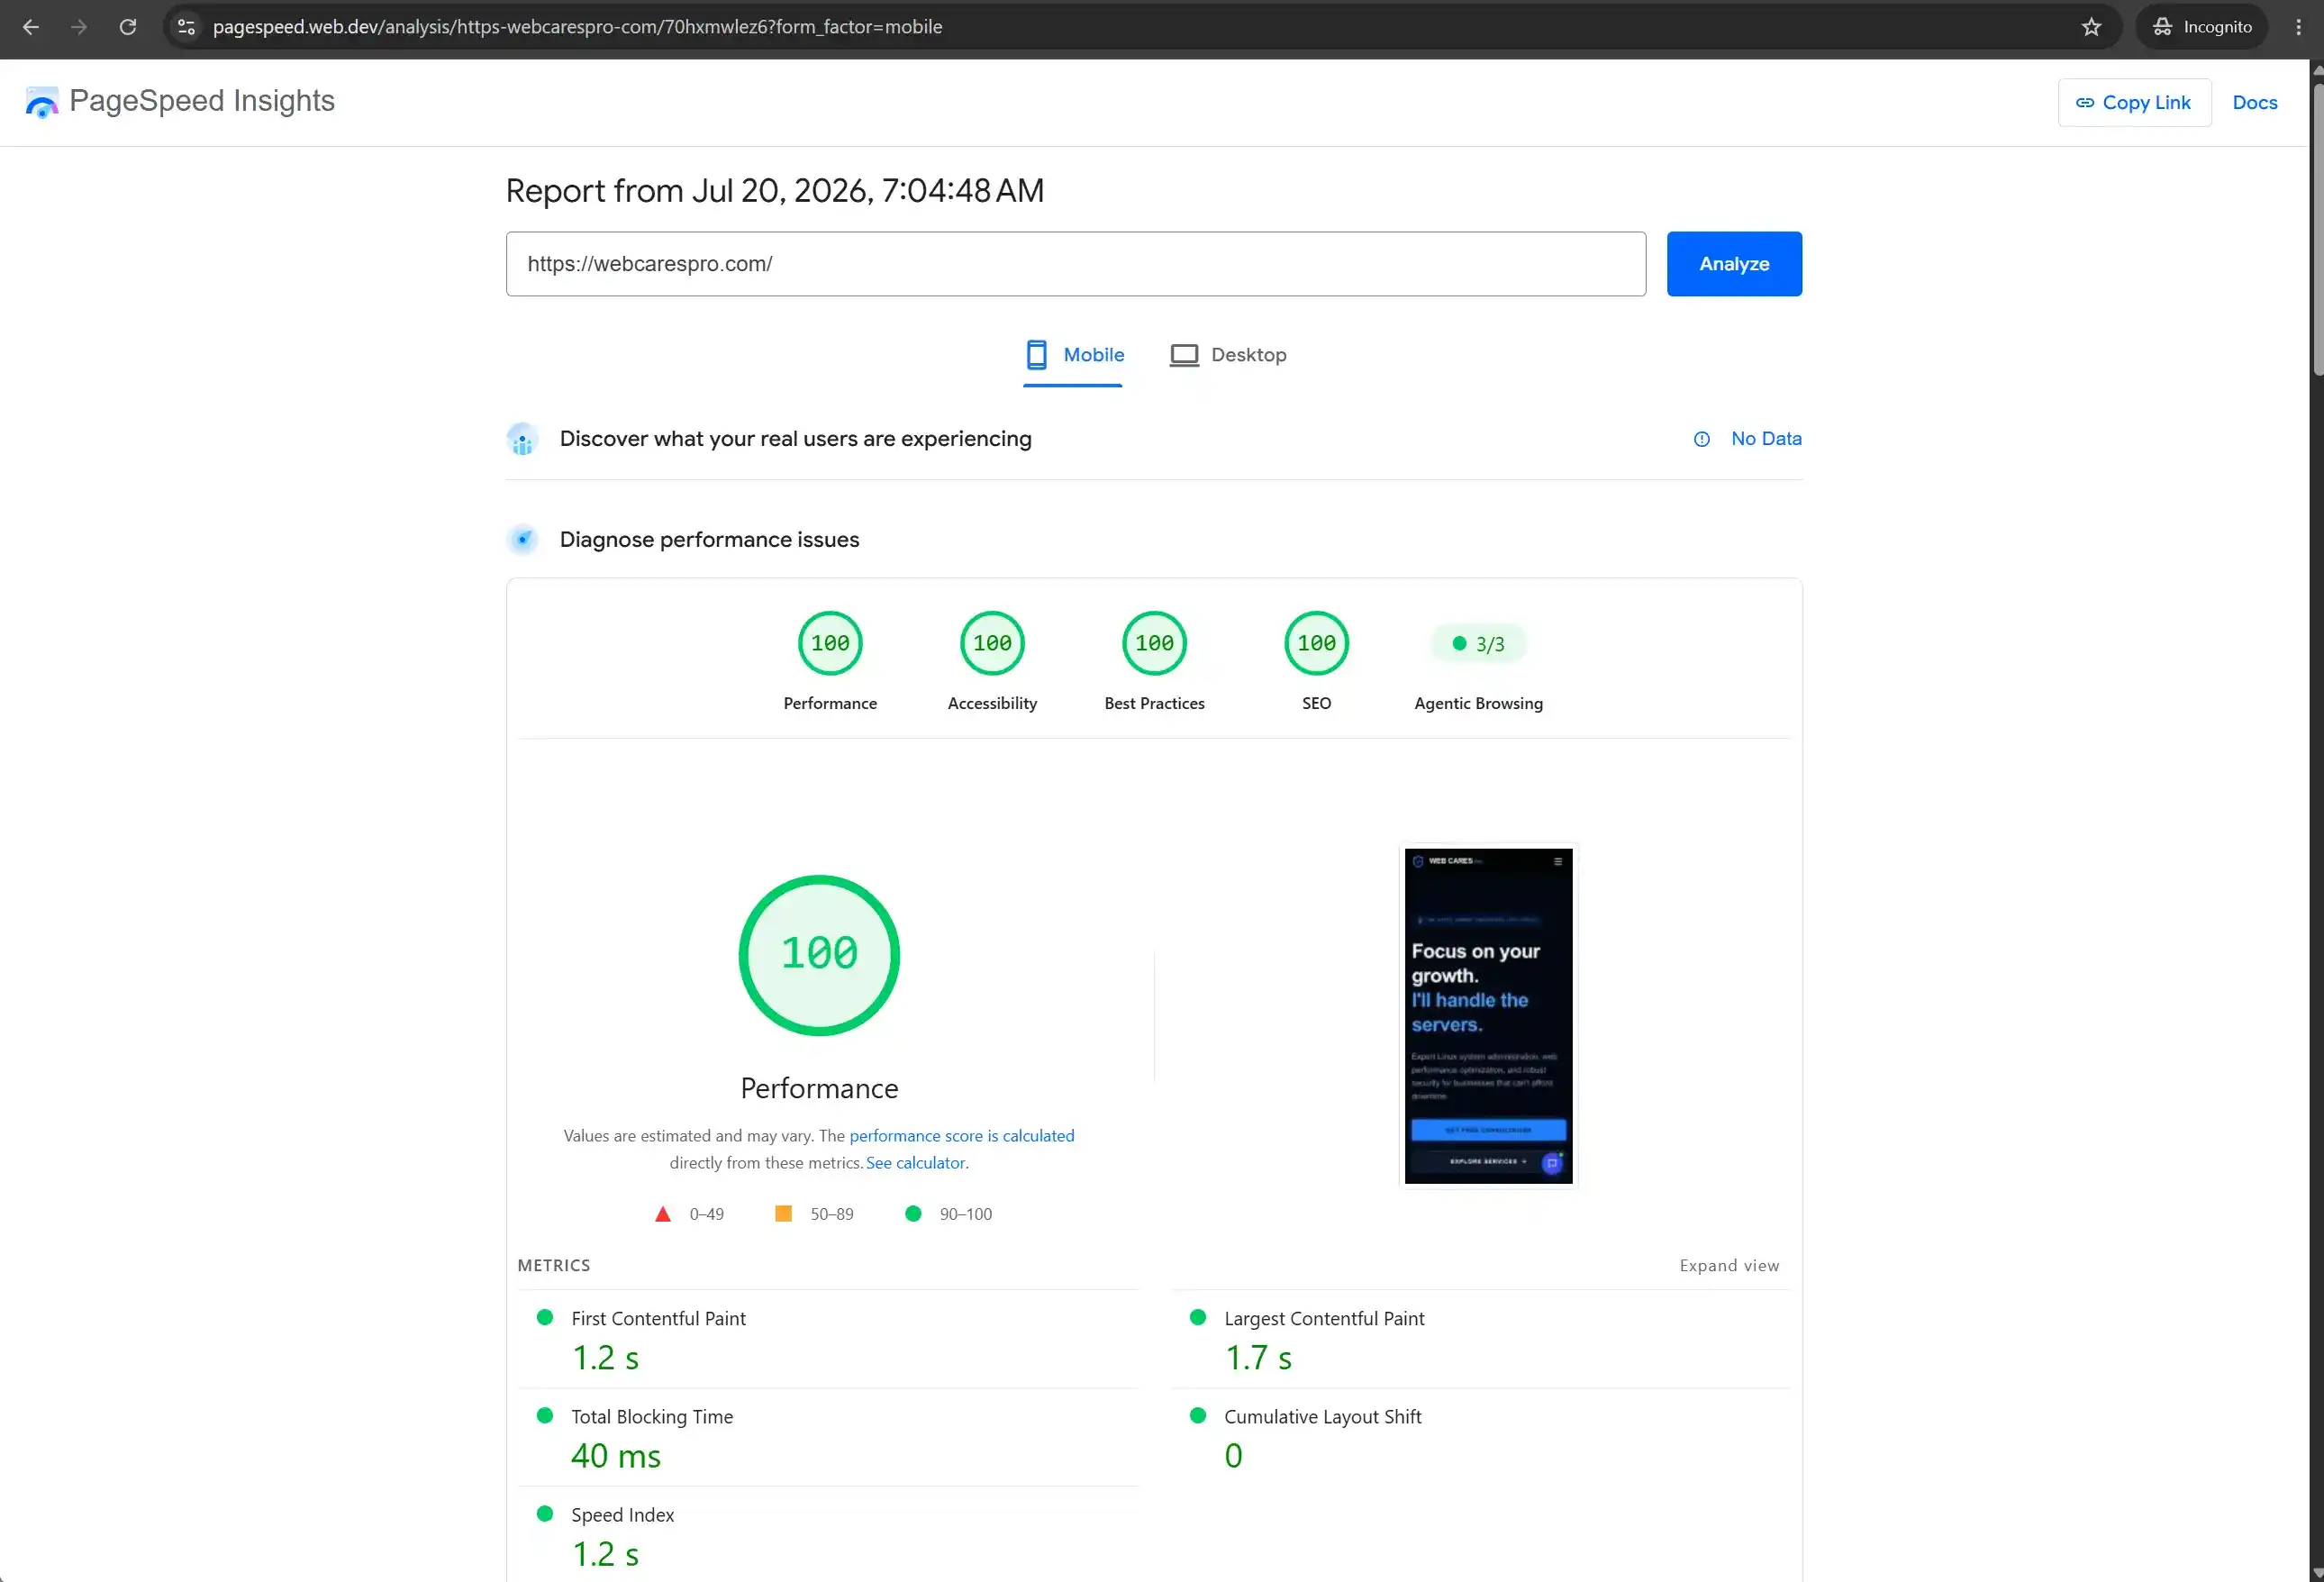
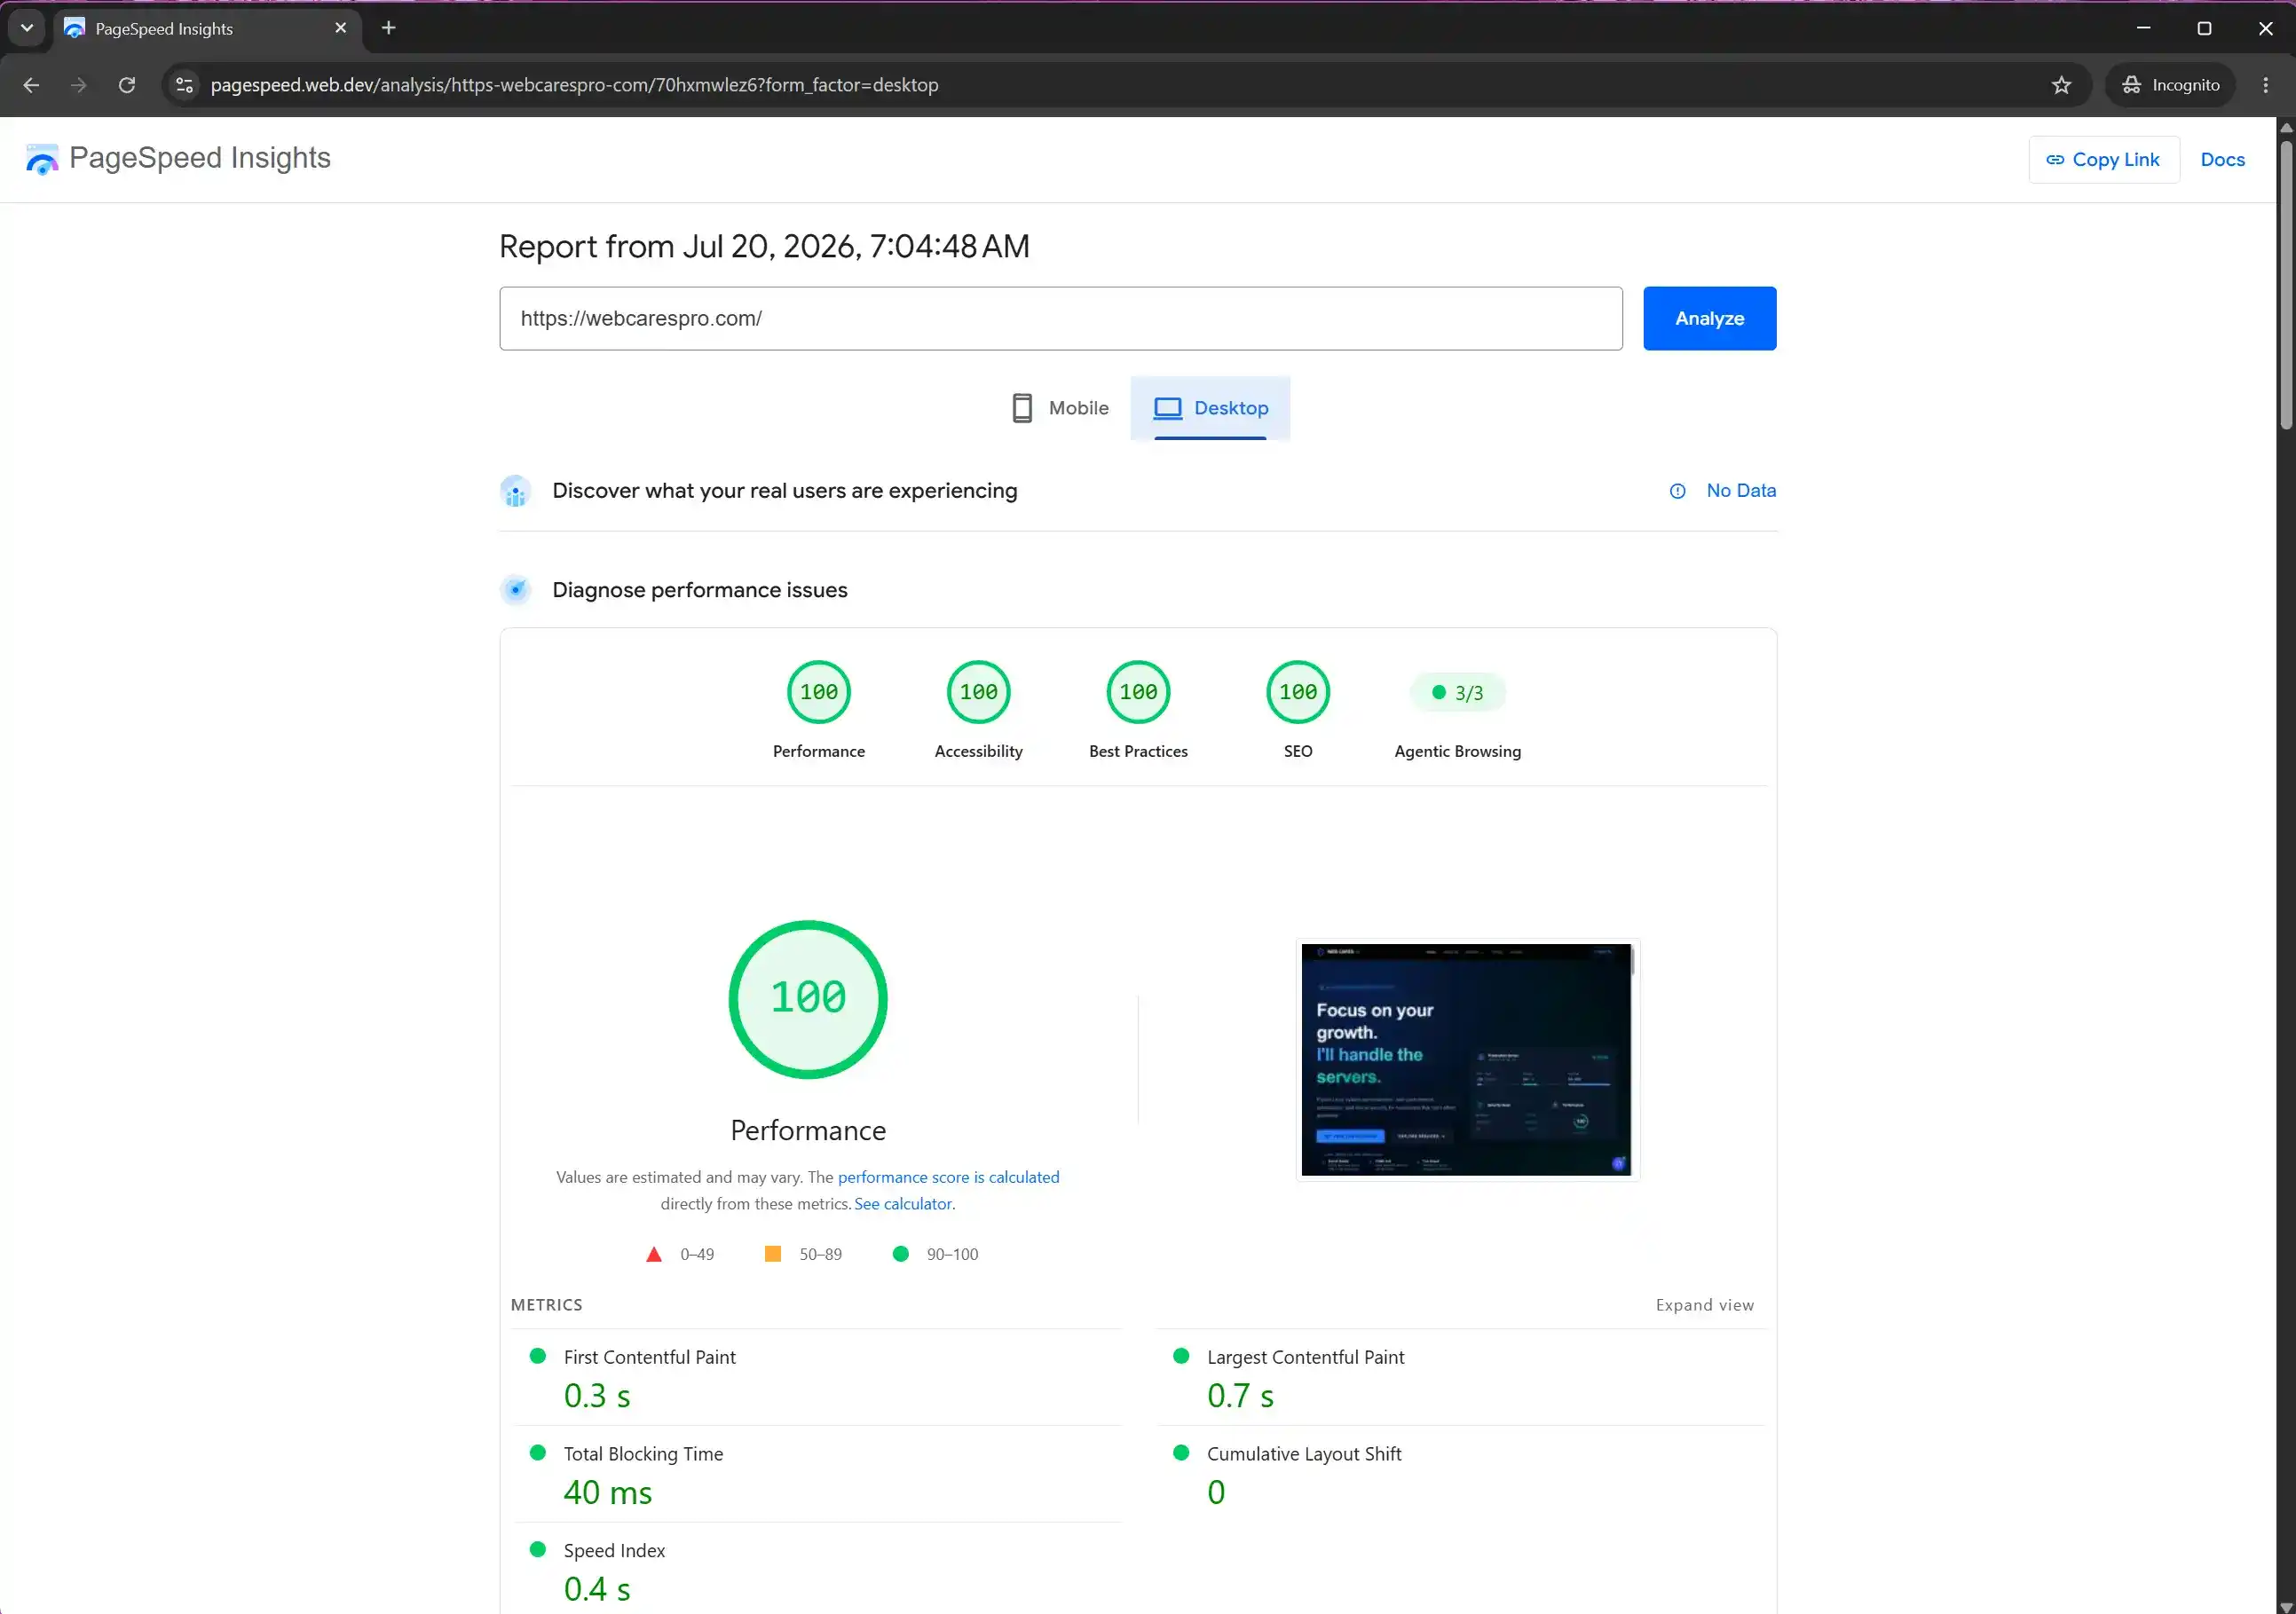
Performance Engineering Stack
Achieving 100/100 mobile & desktop scores requires systematic full-stack optimization:
Advanced Server Tuning
Nginx HTTP/3, Brotli compression, Linux kernel TCP tuning, and TLS 1.3 zero-RTT session reuse.
Object & Edge CDN Caching
Redis object caching & Cloudflare Enterprise edge rules delivering sub-40ms server response times.
Zero Render-Blocking Code
Modular bundle splitting, localized inline CSS, Next-Gen image formats, and complete CLS elimination.
Ready to Speed Up Your Site?
If your website is slow, fails Mobile Core Web Vitals, or suffers from high TTFB, let Mir Alamin optimize it to 100%.
Proven Speed Breakthroughs & Benchmarks
Engineering post-mortems and performance benchmarks demonstrating how I conquer Core Web Vitals, slash LCP to sub-1.2s, and scale high-traffic stores.
Slashed Mobile LCP from 6.8s to 1.2s & Lifted PageSpeed to 99/100
Eliminated render-blocking JS, tuned Redis object caching via Unix sockets, purged wp_options autoload bloat, and conquered INP from 620ms down to 38ms.
Mastering 100/100 Core Web Vitals: INP, LCP & CLS Optimization Masterclass
Deep architectural guide for conquering Interaction to Next Paint (INP), Largest Contentful Paint (LCP), and Cumulative Layout Shift (CLS) on dynamic platforms.
High-Concurrency WooCommerce Tuning: Eliminating Checkout Latency & Cart Lag
An exhaustive technical blueprint for scaling WooCommerce to 50,000+ concurrent users with HPOS, AJAX cart fragment debouncing, and MySQL query tuning.
Proven Speed Test Results
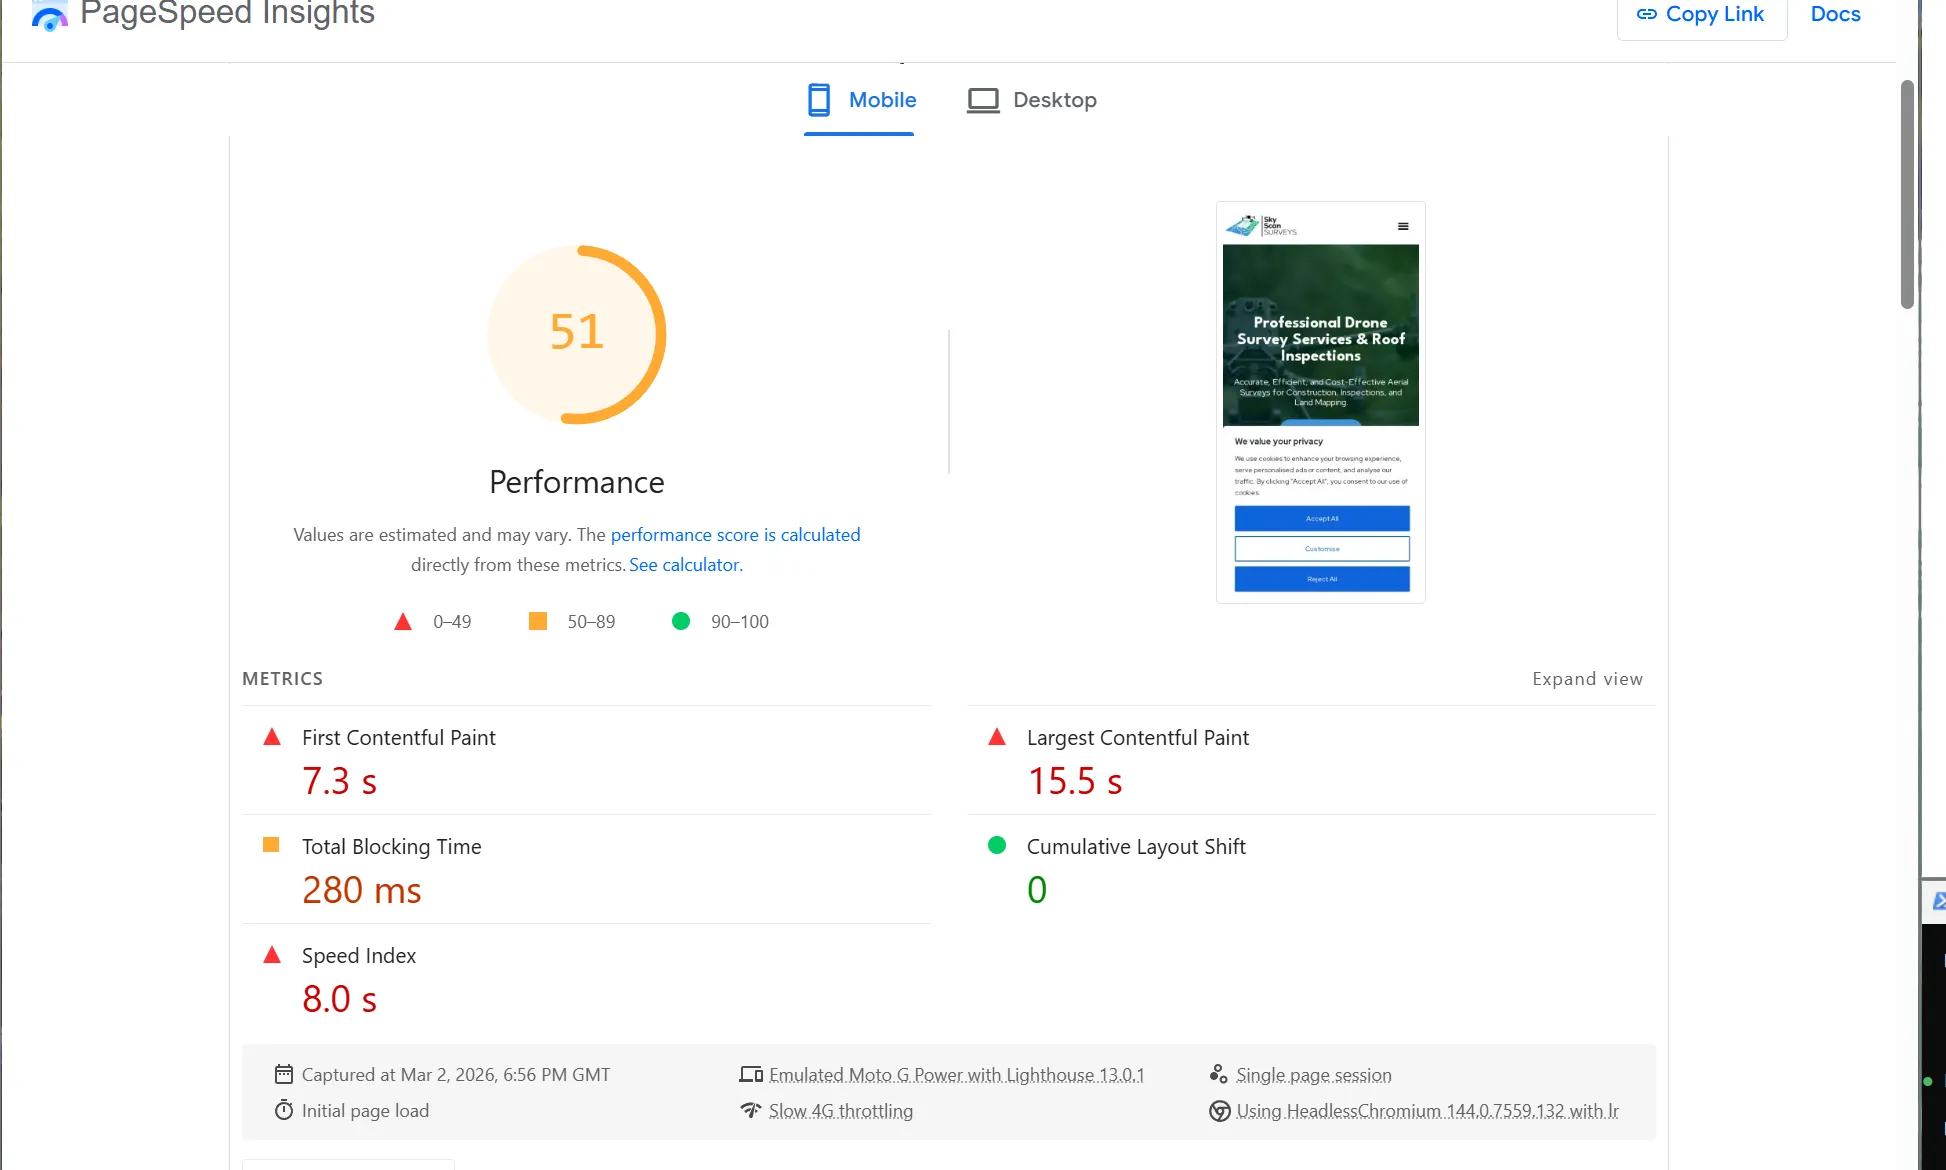
Real performance diagnostic logs and metrics capturing radical loading time drops and excellent 90+ Core Web Vitals targets after optimization.
Due to strict non-disclosure agreements (NDAs) and out of respect for our client's trade privacy, we do not share live client URLs here. However, you can verify our complete contract records, verified case studies, and 5-star customer reviews on our official Upwork work history.
Interactive Performance Comparison Slider
Loader.io Traffic Stress Test — 42ms Average Latency Under Heavy Traffic
100,000 Traffic / 42ms Latency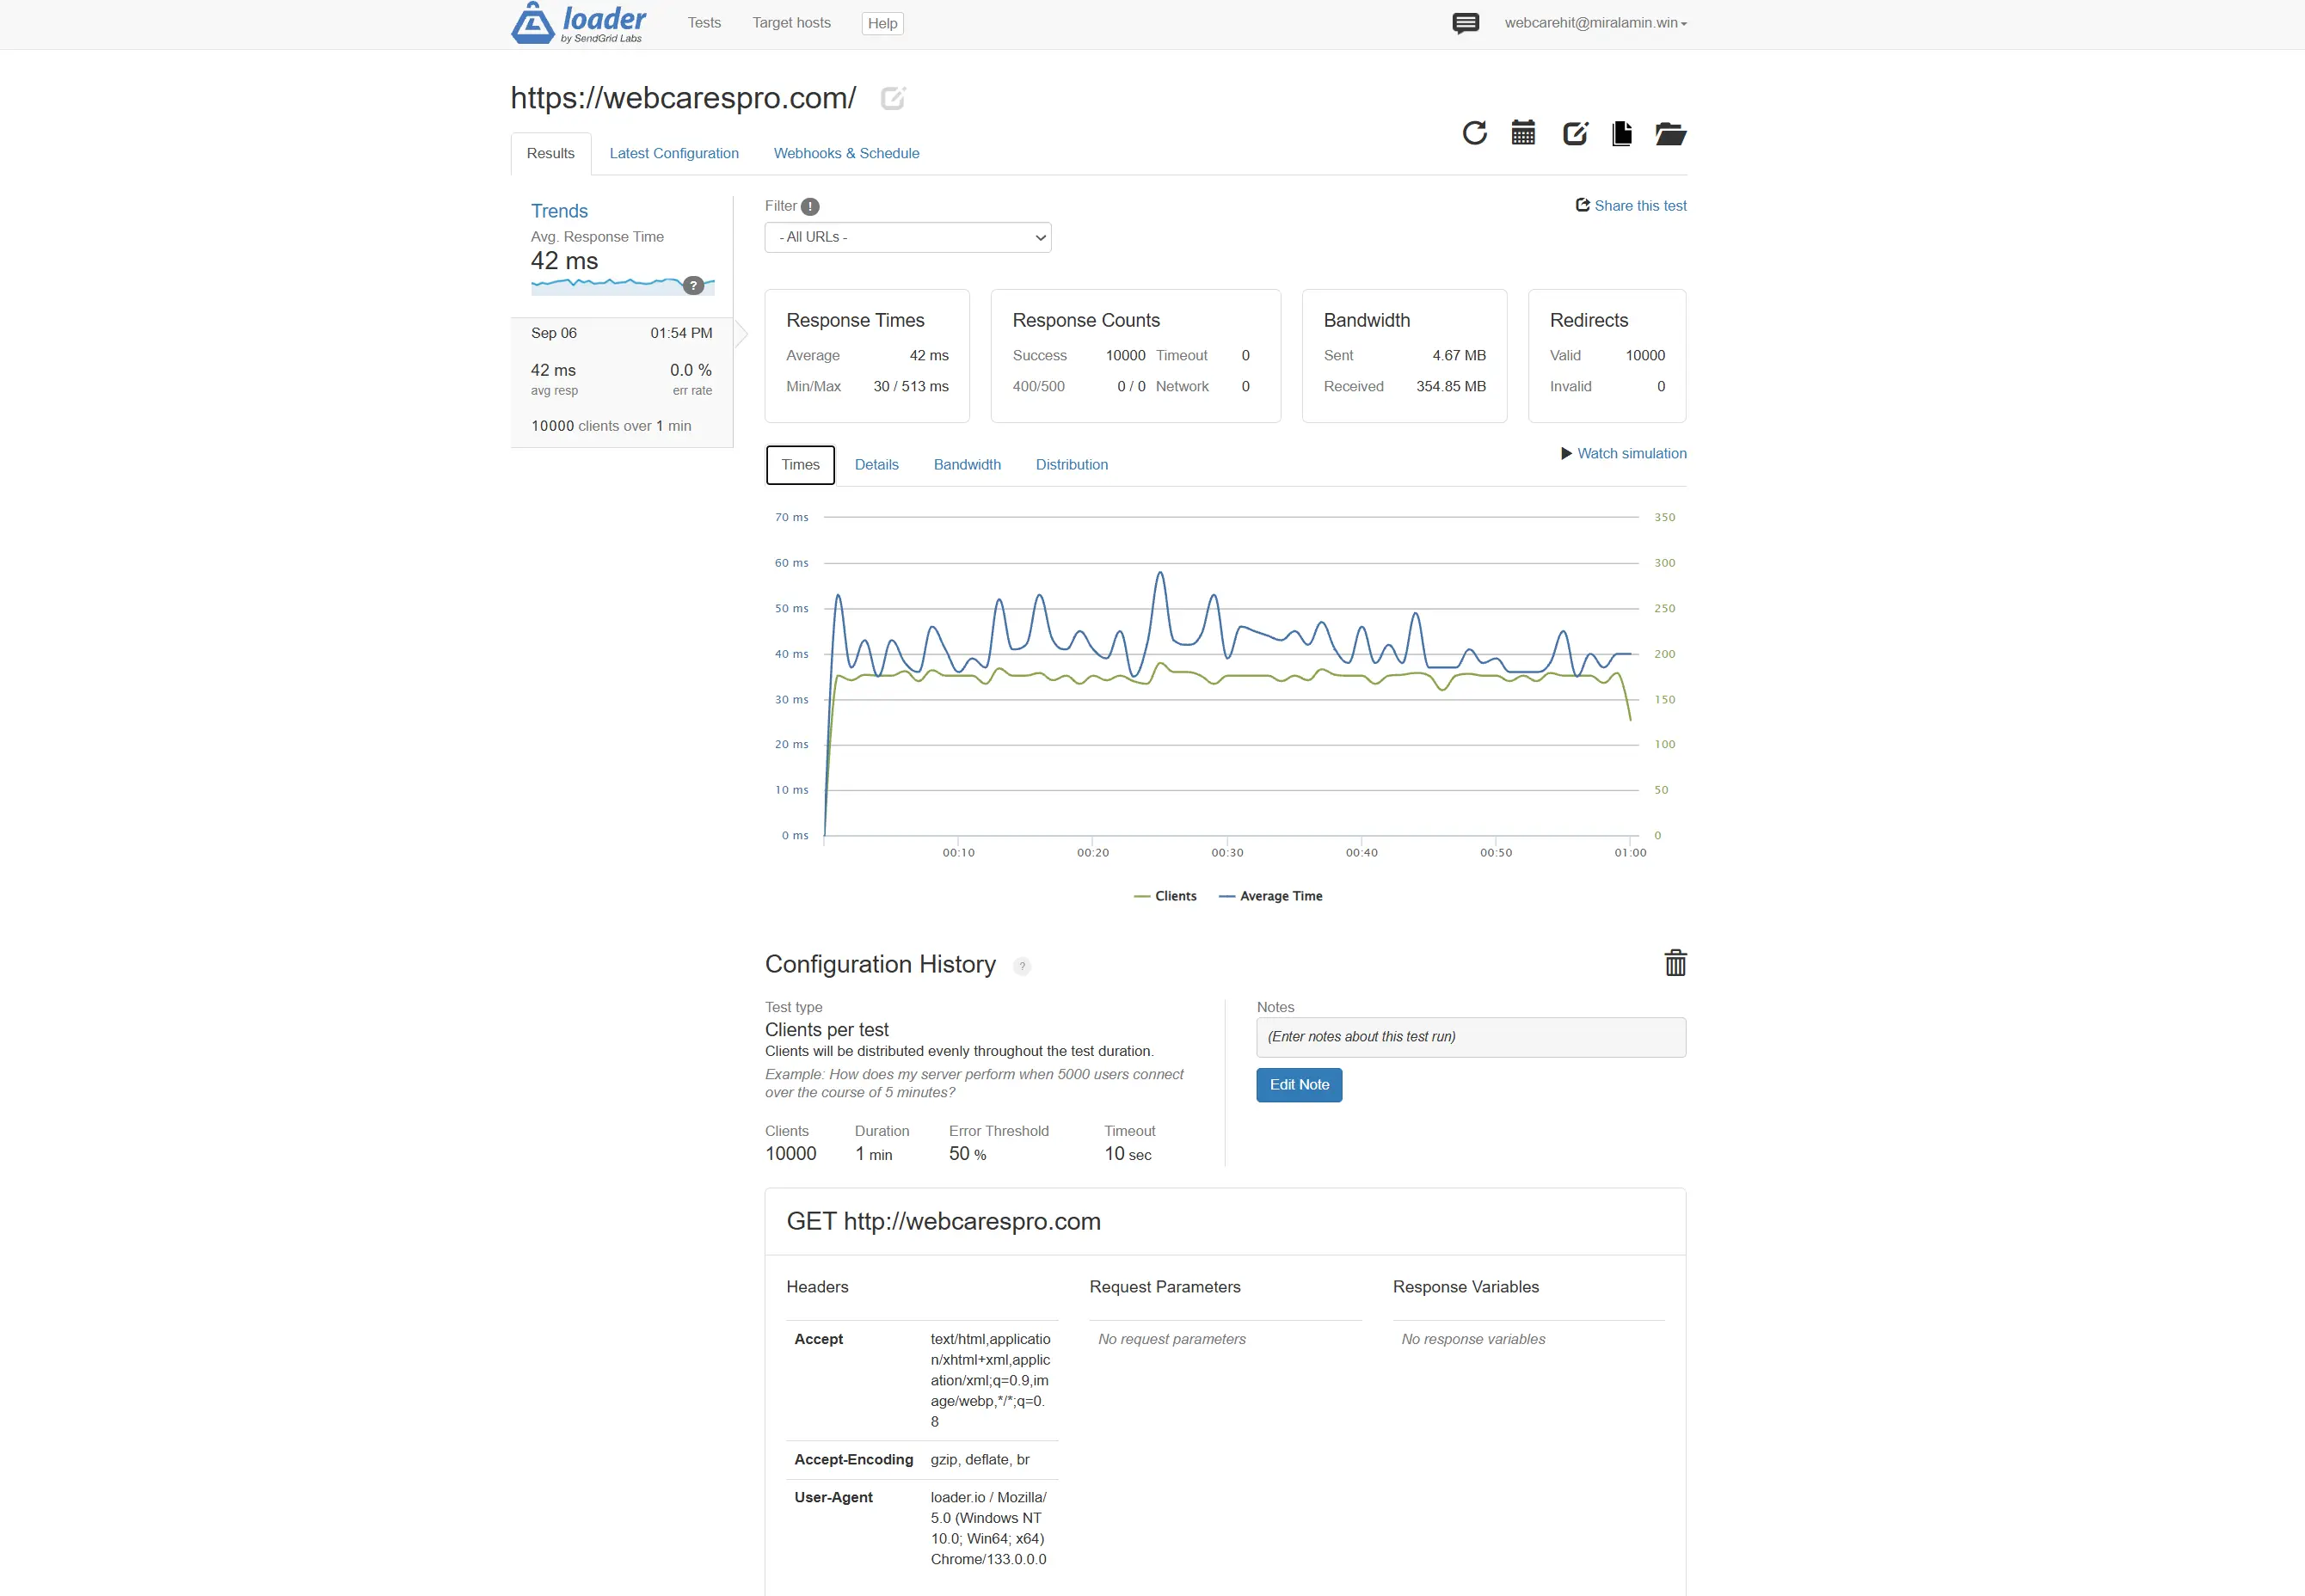
Advanced Actions for Pristine 100% PageSpeed Scores
To secure a perfect 100/100 score on challenging mobile networks, we address high-level performance bottlenecks at the source. Interact with our live diagnostic sliders below to explore our core suggestions.
Active Brotli Level 6 Encoding & Asset Deferral
Raw uncompressed JS/CSS payloads block the browser's rendering thread on slow mobile networks. By compressing all static resources with Brotli level 6 instead of legacy Gzip, and deferring non-essential CSS/JS files, we reduce initial payload weight by up to 80%.
brotli on;
brotli_comp_level 6;
brotli_types text/plain text/css application/javascript;
Redis Server-Level Object Cache & SQL Indexing
Slow origin response time (TTFB) is often caused by repetitive database operations querying option lists and static pages. We index bloated tables and layer a localized Redis object store cache, allowing database calls to return in under 5 milliseconds.
redis-cli info stats | grep keyspace
# keyspace_hits: 4892401, keyspace_misses: 820
Zero-Shift Visual CLS Lock-in & Font swap
As images and web fonts load asynchronously, content shifts on the page, driving up your Cumulative Layout Shift (CLS) penalty. By declaring exact layout dimensions on image nodes, using CSS `aspect-ratio` bounds, and preloading local web fonts with `font-display: swap`, we eliminate visual shifting entirely.
<Image src="/hero.webp"
  width={800} height={600}
className="aspect-video" />Is your website too old to optimize? We can rebuild it.
If your website is built on an ancient framework, filled with outdated code, or has legacy page builders that simply cannot be optimized, don't panic. We can rebuild your website completely from scratch.
We will rebuild your legacy website, keeping the exact same functionality and a highly similar design, for an incredibly affordable price if you sign up for our Web Maintenance Package!
With our premium Web Maintenance Package in place, we handle the transition seamlessly. You will never have to worry about website speed bottlenecks, Google search ranking drops, server uptime, or general website security and health issues again.
Why Rebuild with Us?
- Identical features preserved
- Highly polished layout design
- Rock-solid uptime & speed
- Proactive daily security health
Engineering Transparency: The 100/100 Benchmark vs. Third-Party Reality
Authentic StandardI push every codebase, origin server, and asset cache to target optimal 90–100 Google PageSpeed scores and guarantee passing Google Core Web Vitals across real devices (sub-1.2s LCP, sub-50ms INP, 0.00 CLS). If your website relies on third-party marketing tags (Meta Pixel, Google Tag Manager, Hotjar, or live chat), I isolate, sandbox, and defer them off the main thread. However, absolute synthetic lab scores depend on balancing business tracking tools with rendering performance. I never give fake guarantees—I deliver the highest possible real-world speed your technical stack can sustain.
WebCare Pro vs Typical Agencies: Speed Optimization
Why generic caching plugins fail under real traffic, and how origin-level performance tuning delivers permanent 90+ Core Web Vitals.
| Technical Dimension | WebCare Pro (Mir Alamin) | Typical Agency / Reseller |
|---|---|---|
| Core Web Vitals Guarantee | Guaranteed 90+ Mobile PageSpeed & green Core Web Vitals (LCP < 1.2s, INP < 50ms, CLS 0.00). | Vague promises with zero contractual performance metrics or mobile score guarantees. |
| Technical Methodology | Full-stack origin profiling: Nginx microcaching, PHP-FPM pool tuning & MariaDB/MySQL index audits. | Installs bloated caching plugins (WP Rocket, NitroPack) that mask underlying bottlenecks. |
| JavaScript & CSS Optimization | Granular critical CSS inlining, unused script tree-shaking, and lazy-loading non-critical JS. | Automated minification that breaks frontend checkout scripts and mobile navigation. |
| High-Concurrency Stability | Sub-50ms TTFB globally via edge caching; stable CPU utilization during extreme marketing spikes. | Servers choke and throw 502/504 gateway timeouts when multiple buyers visit simultaneously. |
| Continuous Protection | Active weekly Core Web Vitals monitoring preventing regressions when adding new content. | One-time surface touch-up that instantly regresses the next time an image or plugin is added. |
Full-Stack Page Speed Alignment
We eliminate technical debt and server bottlenecks in a single, thorough overhaul. Upgrade your page speed, secure search relevance, and deliver immediate load speeds.
Frequently Asked Questions
Website speed directly determines conversion rates, bounce rates, and Google organic search rankings. Google uses Core Web Vitals (LCP, INP, CLS) as a verified ranking factor, and WebCare Pro performance benchmarks show that reducing page load times below 1.2 seconds can boost conversions by up to 25% while slashing mobile bounce rates.
Have another question about Speed Optimization & Web Vitals?
If you have any other question you can ask our AI. Our AI assistant will answer all your questions about passing 100/100 Google PageSpeed, optimizing LCP/INP/CLS metrics, Redis object caching, and database query optimization.
Client Testimonials & Reviews
Direct feedback from clients who trusted WebCare Pro for high-stakes server tuning, hack recoveries, and speed optimization.
Wordpress Speed Optimization Expert Required
"Fast, highly motivated and very skillfull."
Verified Client
Upwork Top Rated Contract
Increase my website speed
"Great to work with Mir as always! He is fast, knows his sh*t, and always does a great job. Highly recommended!!!!"
Verified Client
Upwork Top Rated Contract